Using GIS and Mathematical Models as Decision Making tools
|
|
What is GIS (Geographic Information System)?
Watch this video to get a quick background on GIS and how it is used as a planning and decision-making tool. |
Click the button
Scenario
NOAA has identified the Choptank Watershed as a Habitat Focus Area in 2014. Assume that you work for NOAA and your goal is to analyze the land use and water quality data for Greensboro, a subwatershed within the Choptank Watershed and design an implementation plan to improve the water quality.
Follow the steps below to design and develop your implementation plan.
Step 1 (Engage): Graphing Land Use
Use the Greensboro 2011 Land Use map to calculate and create a graph to show the percentage of each land use category.
Click on each land use category, record the "Area in Hectares" and calculate the percentage for each land use type.
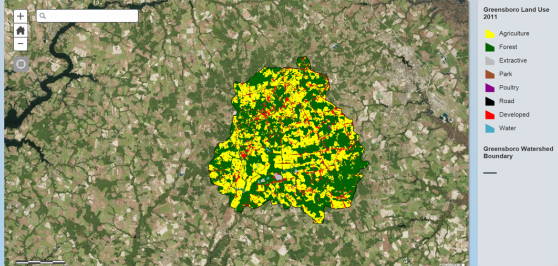
Click on the map to interact with the Greensboro 2011 Land Use map.
Step 2 (Explore): Claim, Evidence and Reasoning
Analyze the following table and graphs to study the relationship between population, land use, fertilizer use and water quality.
Analyze the following table and graphs to study the relationship between population, land use, fertilizer use and water quality.
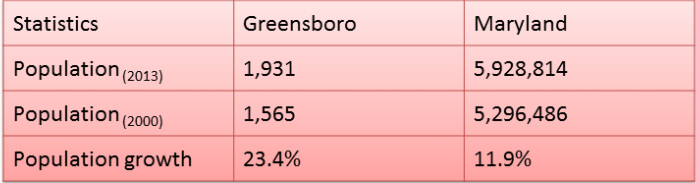
Table 1: Comparing demographic data between Town of Greensboro and Maryland.
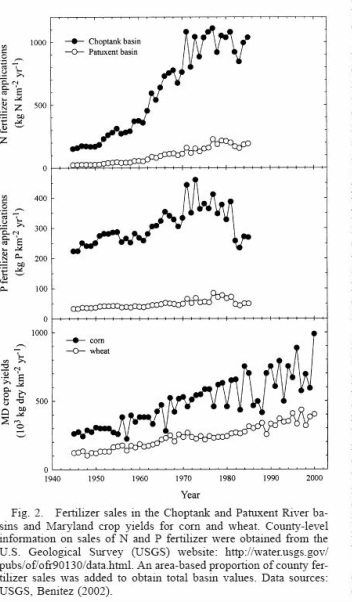
Graph 1: Comparison of fertilizer use between Choptank Basin and Patuxent Basin
|
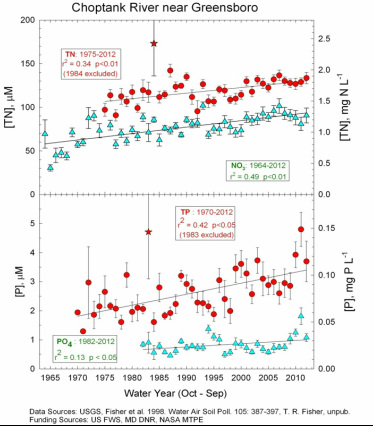
Graph 2: Water quality data from USGS gauging station at Greensboro Md.
|
Step 4 (Elaborate): Using GIS and Models
Watch the video to get a quick background of how Dr. Fisher developed the Greensboro Watershed BMP Spreadsheet Model.
Watch the video to get a quick background of how Dr. Fisher developed the Greensboro Watershed BMP Spreadsheet Model.
|
| ||
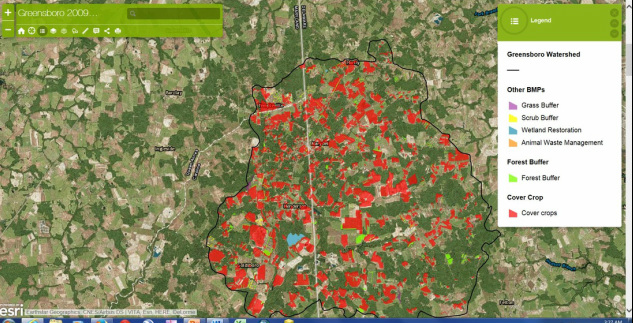
Click on the map to identify locations for your BMP plan
Step 5 (Evaluate): Creating and Communicating
Compile the data gathered from the previous steps and communicate your implementation plan for the Greensboro watershed by creating a report.
In your report, discuss some of the problems encountered in solving water quality issues.
Compile the data gathered from the previous steps and communicate your implementation plan for the Greensboro watershed by creating a report.
In your report, discuss some of the problems encountered in solving water quality issues.
| gis_and_models_student_handout_final.pdf |
Acknowledgement
I thank the following individuals:
-Keota Silaphone, Ph.D Graduate Student (UMCES- Horn Point Lab) and Lecturer (Salisbury) for training me in GIS; encouraging me through every step of this project; working with me (even on weekends) and helping some of my ideas into reality.
-Dr. Tom Fisher (UMCES- Horn Point Lab) for supporting me through the RET; developing the BMP model and providing research data to support this project.
-Dr. Laura Murry (UMCES- Horn Point Lab) for her inputs and support.
-Salisbury University (Department of Geography and Geosciences) for allowing us to use their facilities
-Jane Whitelock (Easton High School) my "partner-in-crime" for her constant encouragement.
-Last, but not the least, my husband (Bhaskaran) and son (Adithya) for being my pillar of support at home and putting up with my seven-day work weeks and long nights with a smiling face!!!